- THE NORTH WOOD FACTORY -
500 TERRY FRANCOIS STREET SAN FRANCISCO
MON-FRI 7AM-10PM | SATURDAY: 8AM-10PM


Media Usage
Information Design | Infographic
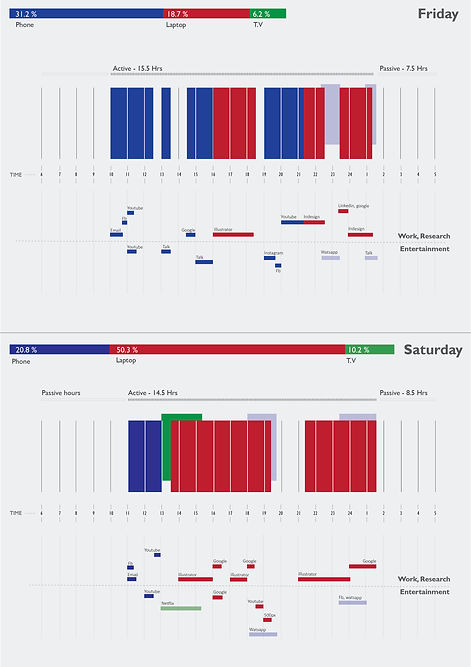
The project examines the process of self-tracking media usage over a week using widely available apps and devices. Data was recorded on a daily basis and represented.
Data recorded over a week included
-
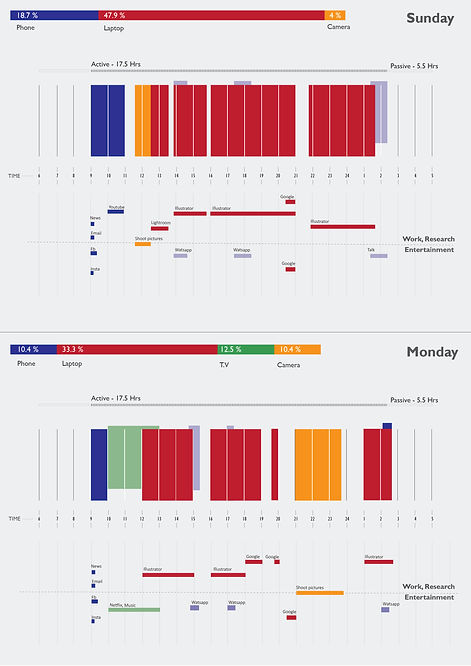
Type of media used(phone, laptop, camera)
-
software used in the device(illustrator, lightroom, youtube, etc.)
-
Hourly data analyzed
-
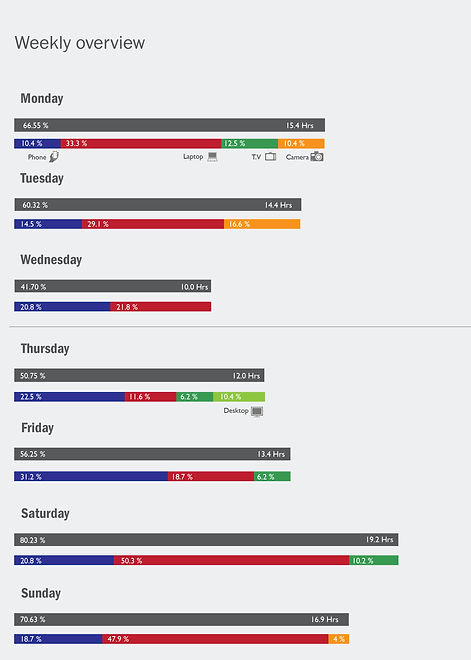
total number of hours with media per day
-
No of active and passive hours.
The idea was presented as an accordion providing the flexibility of reading it either as a book or a poster. The graphic is designed in two sections.
Section 1 - shows the weekly totals and the type of media used and their respective totals.
Section 2 - shows the detail view. Each day is divided into 24 hours and the data is recorded by hour. Here, part one shows data related to the type of device used and part two shows the software used in the device at that hour.