The maze of 3 trips
Information Design | Infographic
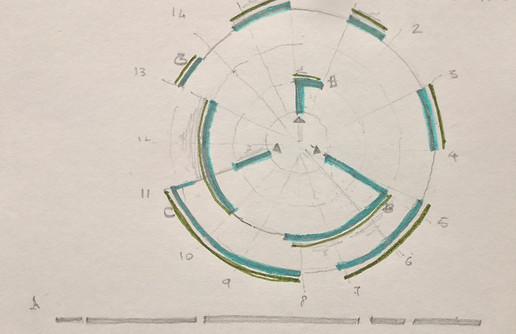
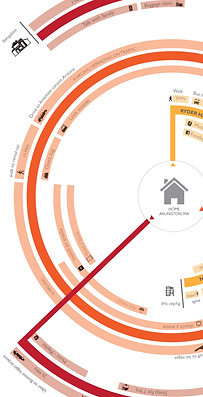
In this project, I recorded data from 3 trips in my personal life. One was from home to school, from home to a destination of my dream and home to my home country. The infographic is represented as an abstraction of earth. Every trip has details of when I start, what I ate, the music I listen to.
I have never been as aware of things I do en route. The project taught me to be aware of situations. This helped me a lot in the process of data collection by observation. The project includes
-
Geographic location
-
Distance
-
Activities en route
-
Mode of transportation
-
Time
-
Destination
I would like to further develop this by adding factors such as emotional response, Altitude, local time and temperature
Process and details


This project was made for Douglas Scott's Information Design Studio at Northeastern University, towards my MFA in Information Design & Visualization. Digital Print, 17.5" x 23.5"